Mostrando entradas con la etiqueta Pfam. Mostrar todas las entradas

4 de abril de 2022

Dominios de función desconocida (DUF) en proteínas

Hola,

como ya hemos mencionado en otras ocasiones aquí, las proteínas habitualmente tienen uno o más dominios con determinadas funciones. Por eso cuando analizas secuencias de proteínas recursos como Pfam (incluída en Interpro) o CDD son muy útiles.

El crecimiento de las colecciones de secuencias es tan rápido que a veces se definen dominios o familias de proteínas sin saber realmente qué función tienen. Sabemos que existen, porque sus secuencias están conservadas en los genomas de diferentes organismos y se pueden alinear, pero todavía no hay evidencias de en qué procesos bioquímicos participan. Son los llamados Domains of Unknown Function (DUF).

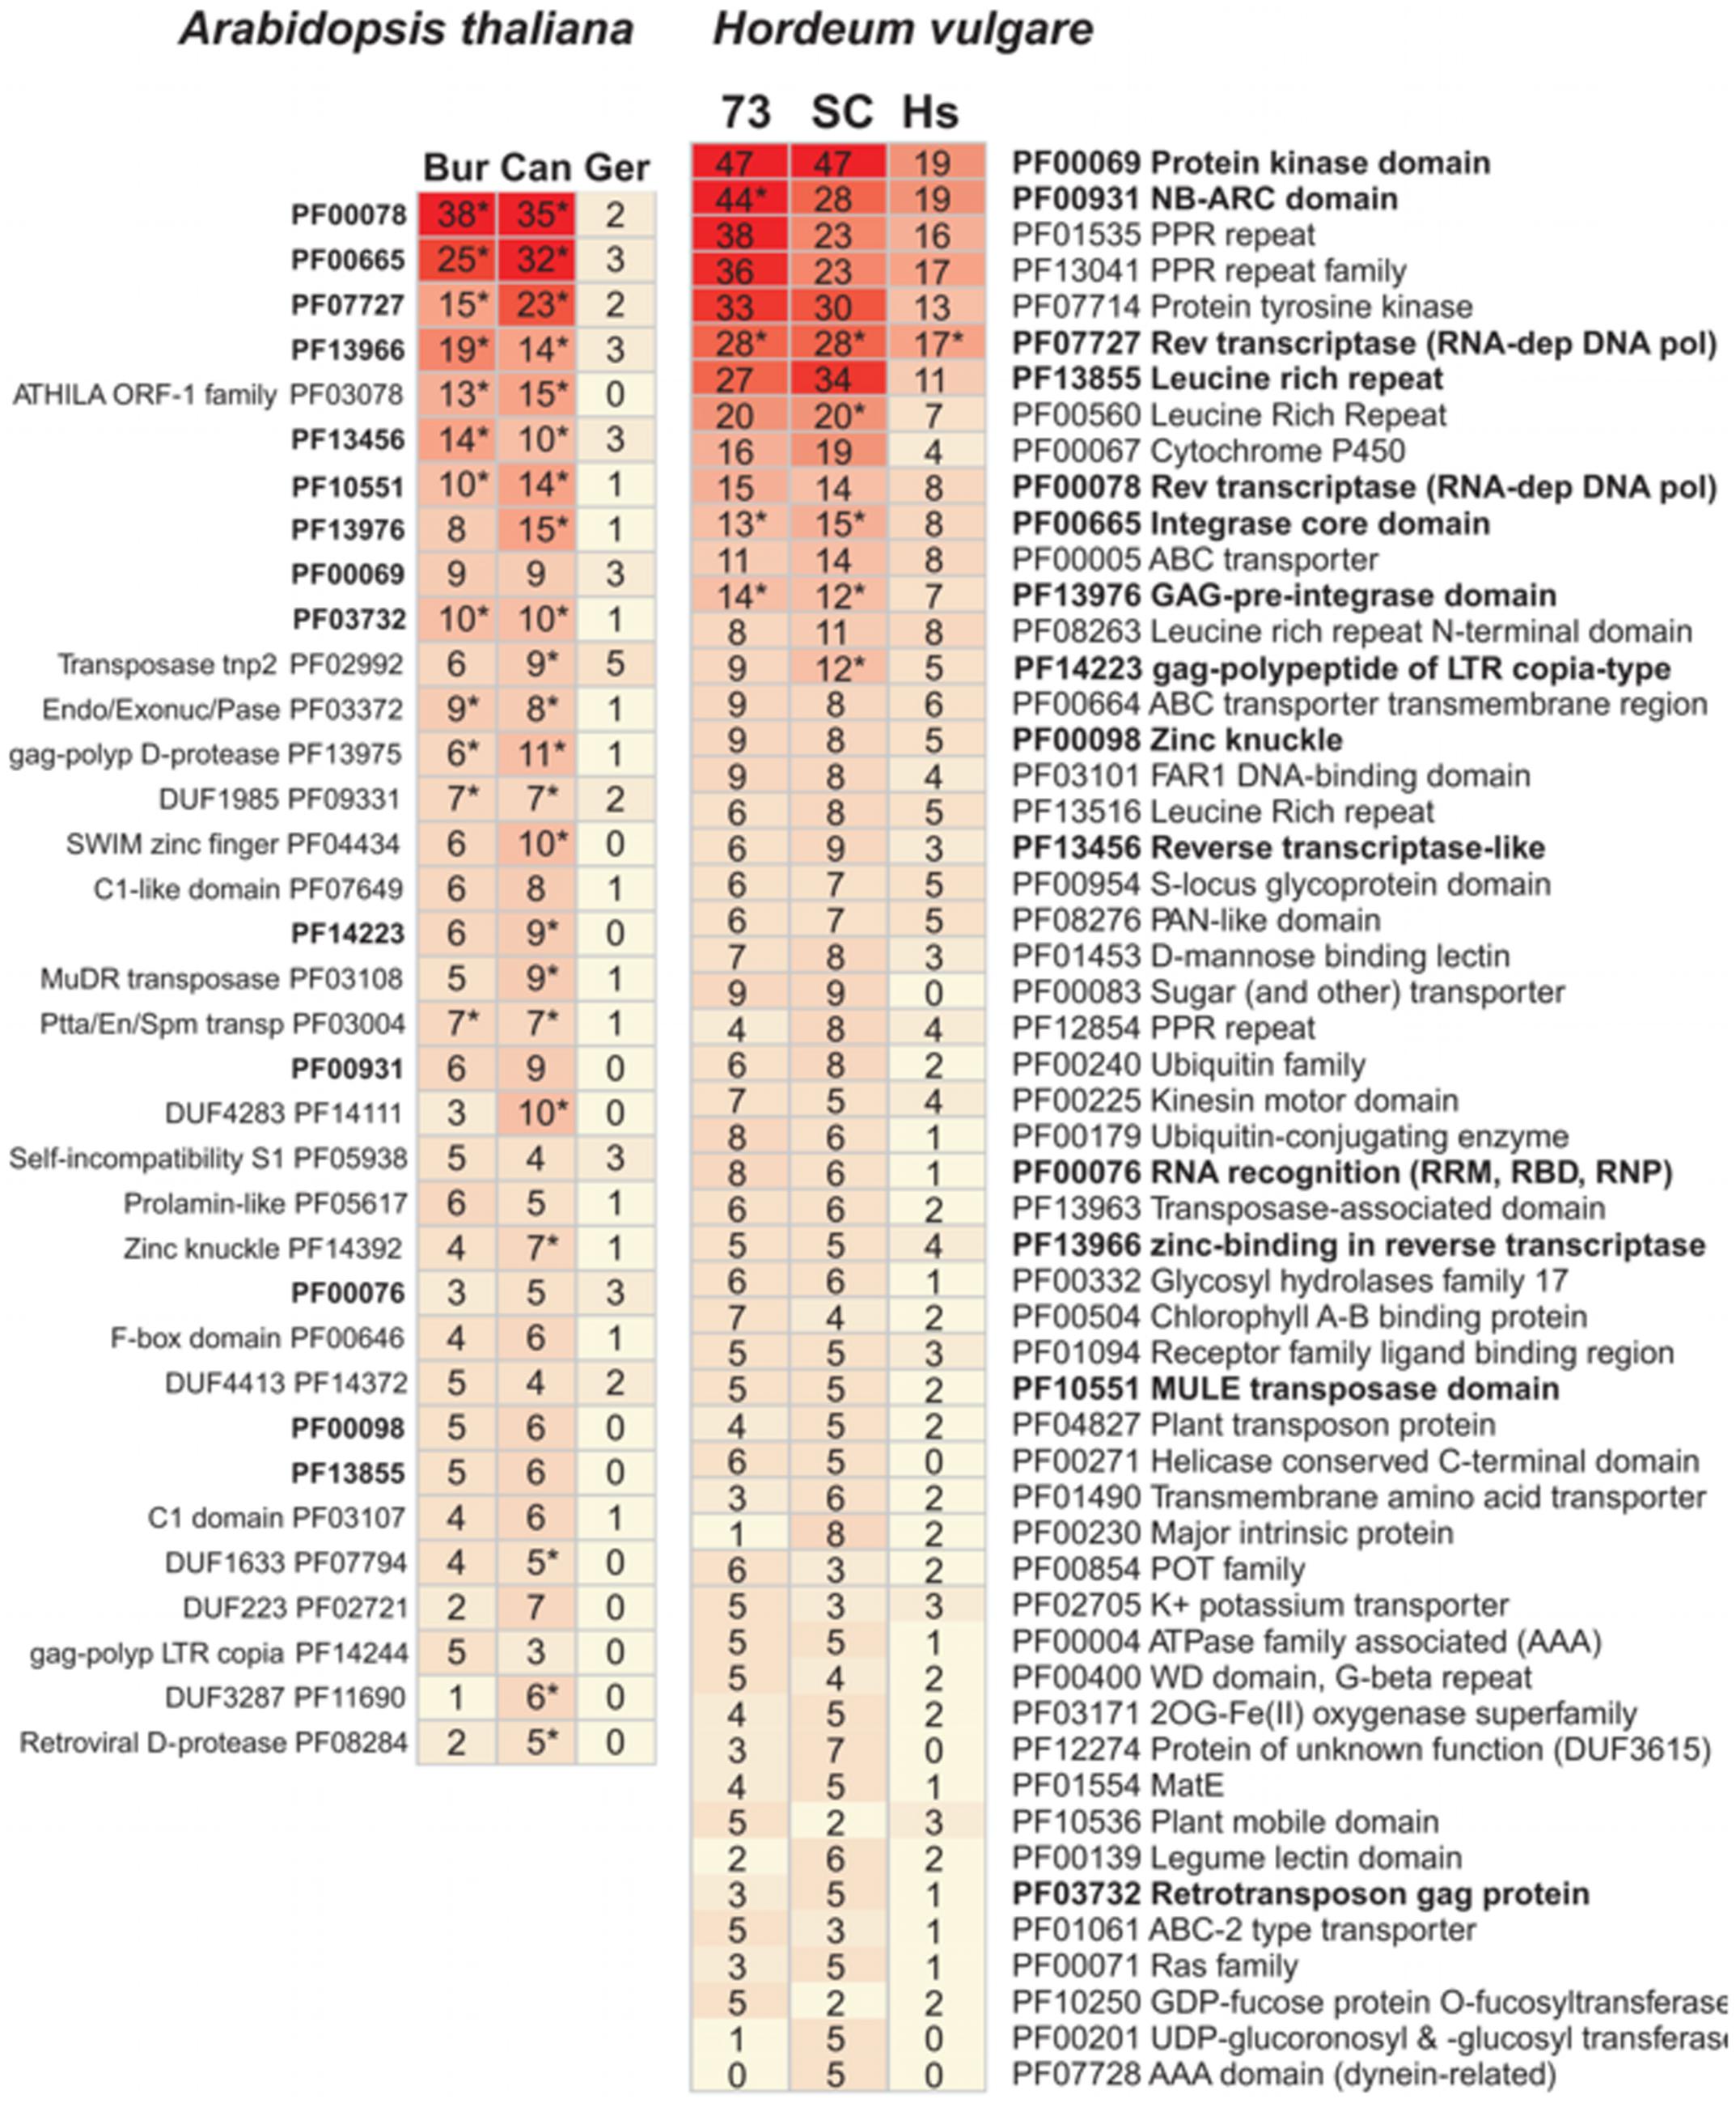
Hace unos unos años Carlos Cantalapiedra y yo descubrimos tránscritos en cebada y en Arabidopsis thaliana que contenían dominios DUF. Entre ellos está por ejemplo DUF3615, pero todavía no sabemos si son importantes o no:

https://www.frontiersin.org/files/Articles/238135/fpls-08-00184-HTML/image_m/fpls-08-00184-g005.jpg

Figura 1. Dominios de Pfam encontrados en tránscritos accesorios de Arabidopsis thaliana (izq) y cebada (der). Fuente: https://doi.org/10.3389/fpls.2017.00184

La continuación de esta historia la encontramos en un artículo muy reciente, donde los autores descubren una pareja de proteínas, una de ellas DUF1644, que tanto en arroz como maiz interaccionan entre ellas y, al hacerlo, afectan al número de granos producidos, un caracter de enorme interés en la agricultura:

Figura 2. Interacción entre KRN2 y DUF1644 confirmada en ensayos Y1H (A) y ensayos de complementación con luciferasa en hojas de tabaco(B). Adaptada de https://doi.org/10.1126/science.abg7985


Queda claro que los dominios DUF son una fuente interesante por explorar. Lo lógico sería que con el tiempo se vayan convirtiendo en familias de función conocida, pero la verdad es que este ejemplo tampoco nos dice mucho de la  función de DUF1644, solamente que interacciona con otras proteínas.

Hasta pronto,

Bruno

18 de septiembre de 2012

TFcompare - a tool for structural alignment of DNA binding protein complexes

I want to introduce you the new bioinformatic contribution of our lab to the science world: TFcompare (http://floresta.eead.csic.es/tfcompare/)

TFcompare is a tool for structural alignment of DNA motifs and protein domains from DNA binding protein complexes in Protein Data Bank

The TFcompare algorithm calculates structural alignments between three dimensional structures of two DNA-protein complexes. The most interesting feature of TFcompare when compared with other methods is that it extracts individual protein domains and their recognized DNA sequences, aligning them separately and returning not only the structure superposition but the DNA sequence superposition too. In this way we can compare single domain affinity for different DNA sequences in DNA-protein complexes, especially transcription factors and their recognized cis elements.

The working schema of TFcompare is the following:


TFcompare takes as input two PDB identifiers. Structures from PDB are retrieved automatically and Pfam domains contacting DNA are calculated and trimmed from the original structure. Then all the domains from the first structure are aligned to all the domains from the second in several steps:
  1. The program MAMMOTH performs the structural alignment.
  2. The produced transformation matrices are applied to the coordinates of the DNA binding sites in order to derive the equivalent cis element superpositions.
  3. Root-mean-squared deviations of superposed coordinates are calculated with beta-carbon atoms (proteins) and with N9 (purines) and N1 (pyrimidines) atoms (DNA).
  4. Structural alignments are scored in terms of i) the number of identical superposed nucleotides (DNA Score 1-0) and ii) the sum of N9 and N1 atom pairs within 3.5 Å (DNA Score).
We can take as example the alignment of 1D5Y and 1BL0 structures, both are bacterial proteins with Helix-turn-helix (HTH) protein domains binding DNA.
We obtain the following results:

Results are ordered by structural similarity (RMSD), from both protein domain and DNA. In green colour are showed the alignment of similar structures (protein RMSD <=5.0 Å and DNA RMSD <= 3.5 Å) and in red colour dissimilar ones. 1D5Y contains two protein chains with HTH domains contacting DNA (trimmed domain structures are 1d5y_A1 and 1d5y_C1). 1BL0 have two HTH domains in its unique chain A (1bl0_A1 and 1bl0_A2). Structural alignment results show how 1bl0_A1 superposes very well with 1d5y_A1 and 1d5y_C1 (green colour). When DNA sequences recognized by these domains are aligned, they show a DNA motif conserved with three common nucleotides ‘CAC’. However, 1bl0_A2 superpositions (red colour) are not as good as previous ones, and DNA motif ‘CAC’ is not preserved when checking the resulting DNA alignment.

Each row contains an alignment of a pair of DNA binding domains, showing a picture of their structures before and after superposition. DNA alignment is also shown.

PDB files with aligned structures can be downloaded by left-clicking on the domain names and DNA sequences. Opening them with PDB viewer software (Pymol for ex.) is possible to visualize the resulting superposition after structural alignment.

Results column headers and their meaning:
Pair: Pair number
Domain_Query: PDB name, chain and domain number of the Query
Domain_Sbjct: PDB name, chain and domain number of the Sbjct
DNA_Query: DNA site recognized by the Query domain
DNA_Sbjct: DNA site recognized by the Query domain
Similar: 1 if both protein domains and DNA sites are below RMSD thresholds, 5.0 A and 3.5 A
respectively
DNA_Alignment: DNA sites structurally aligned
DNA_Aligned: Number of aligned nucleotides
DNA_Score_1-0: Number of identical nucleotides
DNA_Score: Structural alignment score
DNA_RMSD: RMSD of the structurally aligned DNA sites
PROT_RMSD: RMSD of the structurally aligned protein domains
3D_Alignment: 3D Visualization of aligned structures
8 de febrero de 2012

HMMER 3.0, HMMER 2.3.2 or PfamScan?

Last time that I annotated Pfam domains into footprintDB database I used the program hmmpfam from the HMMER 2.3.2 software package. But now, many things have changed, Pfam version has moved from 23 to 26, and the current HMM file can't be used directly with HMMER 2, it needs to be converted with a simple tool of HMMER 3 (hmmconvert -2 Pfam-A.hmm > Pfam_ls_26).

HMMER 3 is a nice software tool that is hundreds of times faster than its predecesor, it takes 20 minutes in my Quad-Core computer the same calculation that took like 2 hours in a 28 node cluster.

So I have decided to move to modern times, but cautiously, because last time I tried HMMER 3 I had not wanted results, so I have done my own benchmark that I'm going to explain...

First, I downloaded a test set of protein sequences from 3Dfootprint, as I work with DNA binding proteins, I downloaded all of them from this archive (currently 2007 FASTA sequences).

To calculate the Pfam domains I used the last version of HMMER 3.0 from http://hmmer.janelia.org/software, my old version of HMMER 2.3.2 (something similar can be found here: http://hmmer.janelia.org/software/archive) and pfam_scan.pl script used by Pfam team to create their database in the Sanger Institute. Also I downloaded the last version of Hidden Markov Models from Pfam version 26 and converted it to use with HMMER 3 (hmmpress Pfam-A.hmm) and with HMMER 2 (hmmconvert -2 Pfam-A.hmm > Pfam_ls_26).

Then I started the testing with the 3 programs, with and without using thresholds in the HMMER param options:
HMMER 2 with thresholds: hmmpfam --acc --cut_ga Pfam-A.hmm protein_sequence_complexes.faa > protein_sequence_complexes.hmmscan
HMMER 2 default: hmmpfam --acc Pfam-A.hmm protein_sequence_complexes.faa > protein_sequence_complexes.hmmscan
HMMER 3 with thresholds:  hmmscan --acc --cpu 8 --notextw --cut_ga -o protein_sequence_complexes.hmmscan Pfam-A.hmm protein_sequence_complexes.faa
HMMER 3 default: hmmscan --acc --cpu 8 --notextw -o protein_sequence_complexes.hmmscan Pfam-A.hmm protein_sequence_complexes.faa
PfamScan (default thresholds): pfam_scan.pl -align -cpu 8  -hmm Pfam-A.hmm -fasta protein_sequence_complexes.faa -outfile protein_sequence_complexes.pfamscan

The final conclusion is that I'll use HMMER 3 with thresholds, it's because the calculation time is 200 times faster that HMMER 2 (Figure 1) and both retrive more or less the same number of domains for the main transcription factor families (Figure 2).

It's remarkable that HMMER 3 without thresholds is very much sensitive, detecting near the double number of domains than the rest of the techniques (Figure 1), but most of them are undesired domains that interfere with the identification of the important ones.

HMMER 2 results with and without thresholds are comparable (Figure 1), both of them detect most of the transcription factor domains (Figure 2), even a bit more than HMMER 3 with thresholds, without including spurious domains even without thresholds (Figure 1).

PfamScan detects less domains than the rest of the techniques (Figure 1), although it uses HMMER 3 internally, this is because it doesn't annotate overlapping domains, but also because it has very strict thresholds that in many cases fail to detect real transcription factor domains (Figure 2). We have noticed this problem in a particula recent study of the transcription factor YY1 (1UBD chain C), if we search in Pfam webserver its sequence (chain C) we obtain only 3 of the 4 real Zinc Finger domains, we must find the 4th Zinc Finger domain among the 'insignificant Pfam-A Matches'.

I hope these results help to decide to people like me dubbing among moving to HMMER 3, use PfamScan or continue using HMMER 2.

Figure 1. Statistics of several parameters with the 5 calculation methods.
Figure 2. Numer of retrieved domains for different transcription factor families with the different methods.